Updated on
 By Bradley Kovacs
Table of Contents

All businesses, especially their sales and marketing departments, thrive on data. Without it, you risk making important decisions purely on gut instinct – and those don't always work out the way you'd hoped.
The way this data is reported, too, is vital. It's one reason why CRM reporting can make all the difference. Can you be sure that your sales agents have access to information that's:
- Easy to understand?
- Accurate and relevant?
- Accessible to all who need it?
Clean, high-quality sales and marketing data can help to improve your lead quality and close deals more efficiently. You need smart, sophisticated reporting systems to crunch the numbers for you into visuals that actually make sense.
Let's dig a little deeper into why reports matter.
What is CRM Reporting?
CRM reporting combines data from various sales and marketing campaigns and channels and manages them through a single system. Within your CRM, you can easily control outreach campaigns, lead details, and journey logs. Reports generated through CRMs provide clear information about your performance and keep track of all the KPIs (key performance indicators) you set.
For example, a CRM reporting tool may let you know:
- How many incoming calls you've received today
- How many people have clicked on paid ads
- How many people are opening your emails
- Which leads are generating the most revenue
We'll dig deeper into benefits, and specific types of CRM reports a little further down, but you hopefully get the idea.
What's really fantastic about CRM reports is that your data are presented visually. Through Ringy, for example, you'll get charts, graphs, and color-coding, as well as just raw numbers.
Sales reps already spend just 35% of their time actually building on leads. It's time to harness that remaining 65%, and it all starts at your dashboard.
What is a Dashboard CRM and How To Use It
A dashboard CRM is the heart of your sales data operation. It's a central hub where you receive and read reports, manage campaigns and start making more confident decisions.
With more conclusive data that's easier to understand and access, your sales agents can spend less time scouting around for leads and more time actually communicating with them.
Sales leaders can provide agents with more relevant coaching for their growth. That way, they can guide anyone who needs help and praise those who go above and beyond.
Additionally, you can easily monopolize tactics that genuinely drive results. With a dashboard CRM, it's easy to spot which campaigns just aren't working.
Your CRM's report dashboard usually comprises:
- Incoming calls
- Recent and upcoming activities
- Deal value
- Lead funnel updates
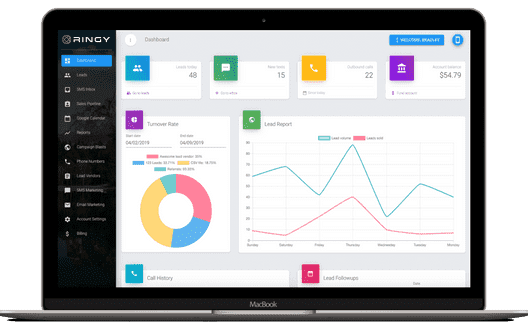
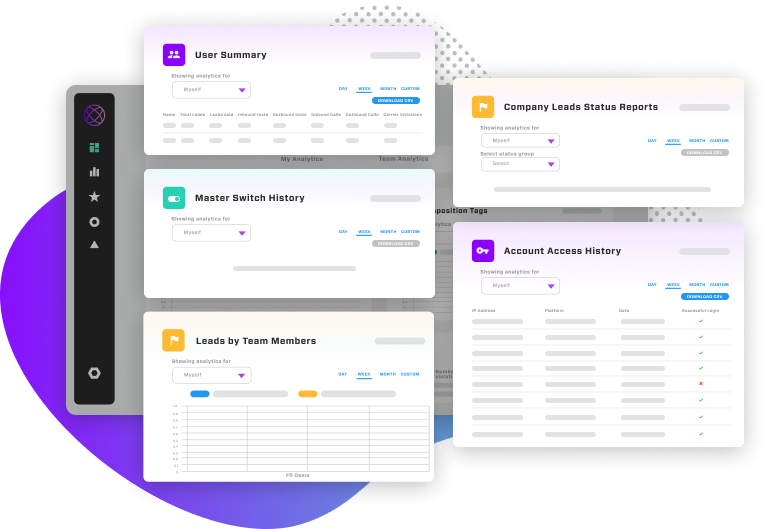
Ringy, for example, provides what we call a "bird's-eye view" of your sales operation. Here's a quick mock-up of our dashboard:

From here, you can access:
- Real-time text message relays
- Incoming and outgoing call numbers
- New leads generated over 24 hours
- Primary lead values and "pie share"
A dashboard CRM can be made accessible to all agents in your sales and marketing teams. It's designed to provide detailed visuals of data they can use to help close sales and improve customer service standards.
The whole point of a dashboard CRM is that it's easier to pull data from than a near-endless database of raw numbers. You can:
- Define goals and KPIs you'd like to track
- Import data sources into your CRM
- Set parameters for how long you'd like to measure data
- Let your CRM produce reports that update in real-time
But how does this all convert into benefits for your business?
The 4 Benefits of CRM Reports for Businesses

First, the benefits in brief:
|
Benefit |
Knock-on Effect For You |
|
You'll know what's working and what isn't |
More effective marketing campaign management |
|
You can see how all your sales start and end |
You'll know where you're making the most money |
|
You can give customers what they want |
Repeat custom, revenue boost |
|
You can plan ahead for growth |
Pivot easier when you hit a "feast or famine" cycle |
And now the details:
1. You'll Know What's Working and What Isn't
CRM reports give you the skinny on how your marketing campaigns are resonating with people. For example, are people opening your emails?
Keep in mind that, on average, email open rates for your business likely vary between 15% and 27%. Are you noticing any wild swings?
CRM reports allow you to compare campaign analytics to give you a stepping stone to determine why this is the case. Is it a difference in your language, or is it simply to do with who you're contacting?
This all makes for greater ROI. You can quickly see which messages aren't inspiring contact and where you can make slight tweaks and adjustments.
2. You Can See How All Your Sales Start and End
A CRM's report keeps you informed about initial lead generation stats as well as tells you how much you make at the end of the funnel. This way, you'll know whether or not it's actually worth reusing the same strategies.
Sale conclusion data also show which leads generate the most revenue and which deserve the most attention.
For example, Ringy helps you to see which prominent leads get the biggest slices of the "pie". Is it more efficient for you to keep pressing lead A when you could get more value from improving your relationship with lead B?
3. You Can Give Customers What They Want
Forecasts, and open rate data available through CRM reports show you what your customers are really interested in.
For example, if you see an uptick in interest in a specific product around the holiday season (or you get that infamous post-holiday slump), you'll know to focus on marketing in that area before November.
The knock-on benefits here could be:
- Fantastic feedback and social proof
- Repeat custom from high-value clients
- Significant revenue growth
4. You Can Plan Ahead for Growth
Visual-heavy data available through a CRM reporting tool will help you forecast sales for months ahead.
You can easily plan ahead for scaling up your marketing efforts, service delivery, and reallocating resources if you're expecting a slow period. Do you need to hire extra staff? Maybe you need to change when you start and end your marketing cycles.
Regardless, simple visuals can help you build speedy plans. It's all about seizing that business growth in double-quick time.
KPIs to Track Using a CRM Reporting Tool
When it comes to effectively managing customer relationships, a CRM reporting tool is an invaluable asset. It allows businesses to gain deep insights into their interactions with customers, helping them make data-driven decisions. That said, here are the key performance indicators (KPIs) you should track using a CRM reporting tool to optimize your customer relationship management strategy.
Close Rate
The close rate is a pivotal KPI for evaluating your sales team's efficiency. CRM reporting tools enable you to track this metric by providing detailed insights into the status of your sales opportunities. For instance, you can use a CRM dashboard to visualize the close rate over time, helping you identify trends and patterns in your sales process. By analyzing this data, you can refine your sales strategies and focus on improving conversion rates.
Net Promoter Score (NPS)
NPS is a critical indicator of customer satisfaction and loyalty. By incorporating NPS tracking into your CRM dashboard, you can gauge how well your customers perceive your brand. CRM reporting tools can help automate the collection and analysis of NPS surveys, making it easier to identify areas for improvement and prioritize efforts to enhance customer loyalty.
Customer Acquisition Cost (CAC)
Efficiently acquiring new customers while managing costs is a primary concern for businesses. CRM reporting tools assist in calculating CAC by providing a comprehensive view of marketing and sales expenses related to customer acquisition. You can use the data to optimize marketing campaigns, allocate resources effectively, and determine the ROI of various acquisition channels.
Abandonment Rate
Abandonment rate refers to the percentage of potential customers who initiate a transaction but do not complete it. CRM reporting tools allow you to track this metric within your sales funnel, helping you pinpoint where customers tend to drop off. By identifying bottlenecks and optimizing your sales process accordingly, you can reduce abandonment rates and boost conversions.
Upsell Rate
Upselling is a valuable strategy for increasing revenue from existing customers. CRM reporting tools can provide insights into customer behavior and preferences, making it easier to identify upsell opportunities. When you analyze upsell rates in your CRM dashboard, you can tailor your sales and marketing efforts to cross-sell complementary products or services, ultimately boosting your average transaction value.
Revenue Generated by Campaign
Measuring the effectiveness of marketing campaigns is essential for optimizing your marketing budget. CRM reporting tools enable you to link specific campaigns to revenue generated. By tracking this KPI in your CRM dashboard, you can assess the performance of different marketing initiatives, allocate resources strategically, and refine your marketing strategies for maximum ROI.
5 Types of CRM Reporting for Your Business

Now we know why CRM reports are fantastic news for your business, here are a few real-life examples.
1. Campaign Performance Reports
CPRs let you know whether or not your campaigns have found you any new leads and additionally, how much revenue (if at all).
Campaign performance reports drill down into SMS, email, social media, SEO, and PPC advertising. You'll see who's clicking your CTA buttons and whether it's worth paying for clicks or sticking with organic search.
These reports also show you how many impressions you made, when, and which channels were the most successful.
2. Lead Source Reports
Lead source reports effectively tell you where you're getting custom. Similar to campaign performance data, you'll see where most of your custom arrives.
Coupled with historical sales data, you'll also get to see which sources are the most lucrative. Is it more profitable, for instance, to pitch via SMS drips than to continue posting on Instagram – or should you stick to purchasing leads in bulk from a vendor?
3. Agent Performance Reports
Your CRM can also tell you which sales agents are closing the most leads and who may need more coaching. These reports break down outbound and inbound call statistics and lead retention rates.
These statistics can be super useful in helping you to shuffle around your team if you feel some agents are better fits for specific campaigns, too.
4. Sales Forecast Reports
Forecast reports work alongside goals and KPIs to determine if you're on track to hit your targets.
You can see whether or not you'll experience feast or famine over the summer months and where you need to take bigger risks in marketing to secure more leads.
The more data your CRM reporting tool consumes, the more accurate you can expect your sales forecast reports to be.
Your CRM will also take into account ongoing campaign performance, too, for a more accurate picture.
5. Pipeline Reports
Pipeline reports show you how your average customer journeys transpire, tracking your leads from initial clicks all the way through to the final sale.
You'll see how many deals are on their way through the line if there are any bottlenecks and your overall conversion rate.
What steps do your leads go through toward a successful sale completion? For example, do SMS follow-ups make a positive difference?
Best CRM Reporting Tool Options
Let's take a look at three of the best CRM reporting tools available on the market:
- Ringy
- Pipedrive
- Salesforce
Ringy
Seem familiar?
We obviously know Ringy like the back of our hand, so we're in a great position to explain why it's a must-have for reports and forecasts.
Ringy is super-easy to get to grips with. It's easy to manage a host of lead and agent summary reports through your "My Analytics" tab, which is just a click from the main dashboard.
Ringy lets you export leads and other tasty data as CSV files, meaning you can easily share it between teams and use them in presentations.
Here's just a taste of the metrics you can track from your dashboard CRM:
|
CRM Tool Option |
Function |
|
Leads Today |
Shows you how many leads you've generated in 24 hours, and where from |
|
New Texts |
Shows you how many SMS you've received from customers in 24 hours |
|
Appointments |
Informs you how many appointments were booked by customers today, and when for |
|
Lead By Vendor |
Breaks down how many leads you receive per vendor, and shows how many sales you've made |
|
Drip Marketing Analytics |
Shows you how many drip SMS and emails you've sent during a given period, and their conversion rate |
|
Outbound and Inbound Texts |
Shows you how many SMS you've sent and received, and lets you filter dates and demographics |
|
Find My Leads |
Lets you see where your leads are coming from, with geographical search and disposition filters available |
|
Agent Summary |
Shows you which agents are registered to your CRM and how many leads they're presently working with |
|
Call Statistics |
Shows you your inbound vs outbound call logs as a total amount |
For example, you can drill down into call analytics to see who's making and taking calls, and measure your outbound / inbound efficiency at agent level.
Best of all, we offer top-of-the-line analytics at a fraction of what you'll pay for other CRMs – that's a nice bonus!
Pipedrive
Pipedrive is just as user-friendly and almost as easy to scale up with as Ringy, plus it's one of the most powerful reporting tools on the market right now.
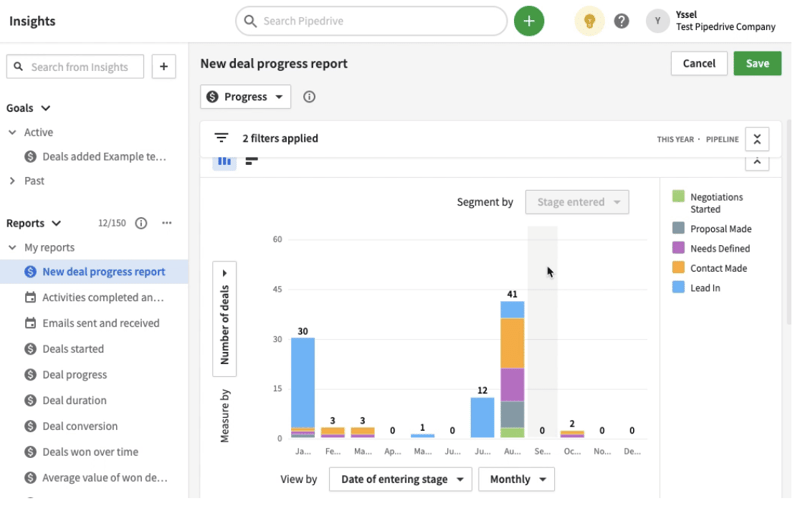
The software's "insights" feature presents a stack of detail and pipeline drivers through easy-to-understand visual charts and displays. Perhaps the best feature of Pipedrive's reporting functionality is its customization, where you can filter out accounts that bring the most money into your business.
Pipedrive also lets you import existing report data (such as clunky spreadsheets) into your dashboard and lets you handily export your data to share with others in your company.
You can even share live dashboard data with stakeholders, board members, and other users, meaning everyone can see the same live reports simultaneously. There's no need to print off your graphs or charts and pin them to the whiteboard.
Salesforce
Salesforce has the benefit over most CRMs of being one of the oldest in the game. It's a goliath in the industry.
This CRM drills a little deeper than most, in that you can either report on "external objects" (such as sources outside the CRM), "standard objects" (those created within the platform), and "custom objects".
This means you can upload and track almost any available data through Salesforce's impressive omnichannel repository.
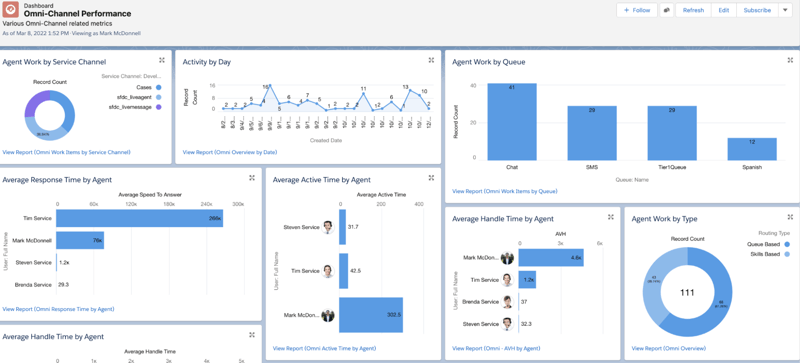
Salesforce operates on a highly visual dashboard that's also near-endlessly customizable. Salesforce recommends building your own dashboards from scratch, rather than settling for default metrics and reporting options.
Salesforce's reporting software allows you to filter down into live orders, social media posts, chatbot conversations, open cases, and calls.
Much like Ringy, Salesforce will also let you export reports with ease. It's easy enough to find this function in any custom report you open up. However, its complexity and price range make it best suited for enterprise users – if you're a small company, it's overkill.
Conclusion

CRM reporting can really make all the difference in how you find and close leads. You can:
- Track agents' sales performance
- Check SMS and email campaign performance
- Work out where you get most of your revenue
- Design a fantastic experience for incoming leads
- Work out future spending and revenue
Your business needs data. Intuitive reporting that's deep yet visually accessible can help you make sense of all the important numbers.
Want to take a look at how all this data looks from your very own dashboard? Get in touch for a free tour of Ringy today.

Skyrocket your sales with the CRM that does it all.
Calling? Check. SMS? Check. Automation and AI? Check. Effortlessly keep in touch with your customers and boost your revenue without limits.