Updated on
 By Bradley Kovacs
Table of Contents
A CRM dashboard is the central point where raw sales data transforms into immediate, informed decisions. It eliminates the need to sift through disparate spreadsheets or fragmented reports, consolidating all essential information into a single, clear, visual, and actionable interface.
Whether you're tracking pipeline health or team performance, dashboards simplify complexity and help you move faster. Let's break down how CRM dashboards work and how to build one that actually drives results.
Key Takeaways
- A well-built CRM dashboard centralizes all your sales, marketing, and customer data into one visual interface, helping teams avoid fragmented insights across tools. Instead of switching between spreadsheets and reporting tool software, dashboards give you a single source of truth. This improves decision-making speed and ensures that everyone, from SDRs to leadership, is aligned on performance metrics and pipeline health in real time.
- The best CRM dashboards go beyond static reports by offering dynamic, real-time updates that reflect current sales activity. This means your team can identify bottlenecks instantly, adjust outreach strategies, and prioritize high-value opportunities without waiting for end-of-week reports. Modern reporting tool software makes it easy to customize views so each role sees only what matters most to them.
- Reviewing strong CRM dashboards examples can help you understand what works and what doesn't before building your own. High-performing teams typically focus on clarity, actionable insights, and minimal clutter. The goal isn't to display every metric, but to highlight the right ones that drive revenue, improve forecasting accuracy, and guide smarter sales strategies.
- Beyond having an engaging UI/UX design, a successful CRM dashboard should also be practical. If your team struggles to interpret the data, the dashboard fails its purpose. The best dashboards are intuitive, easy to navigate, and designed around your sales process. This ensures faster onboarding, better adoption, and more consistent usage across your organization.
What Is a CRM Dashboard?
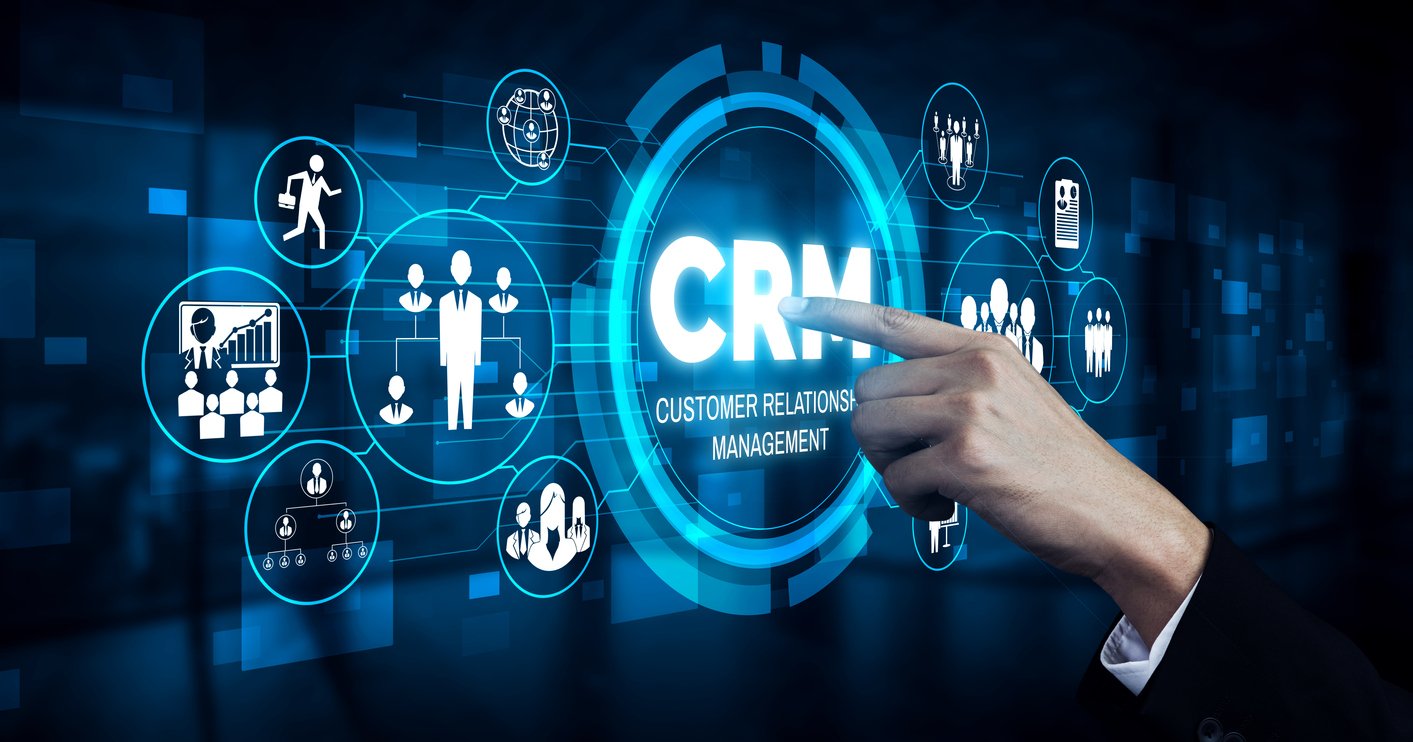
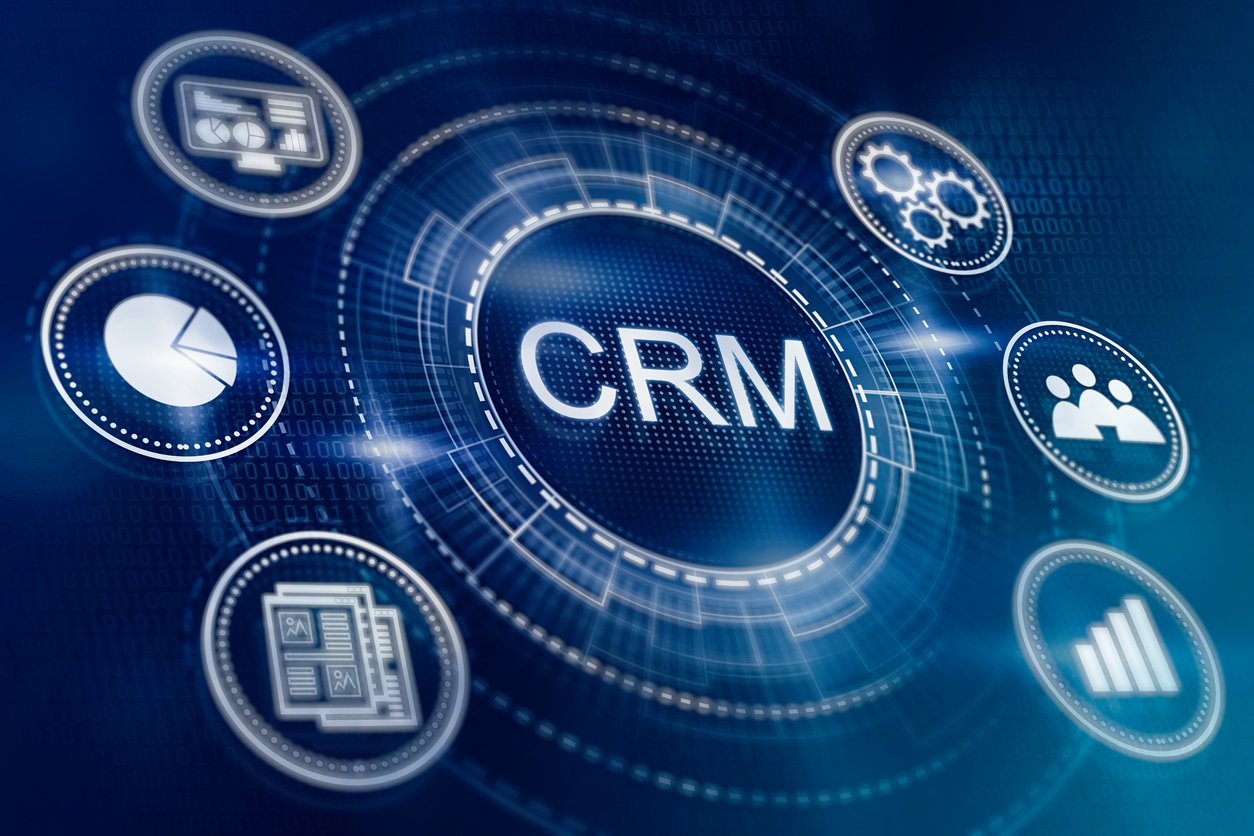
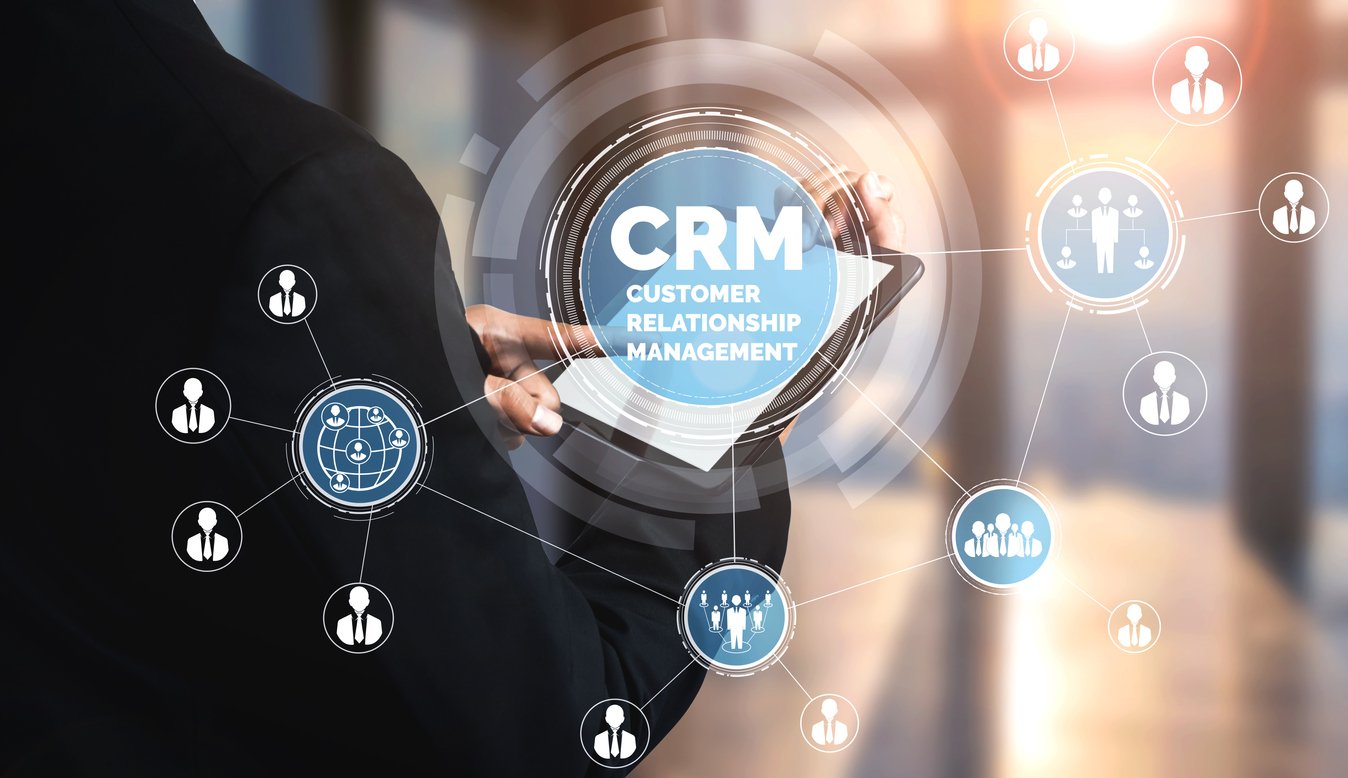
A CRM dashboard is a visual interface within your customer relationship management system that displays key sales, marketing, and customer data in real time. It's a centralized hub for tracking, monitoring, and analyzing various customer interactions and sales activities.
Instead of reviewing raw numbers, dashboards present information through charts, graphs, and summaries, making it easier to understand performance at a glance.
It combines the power of data visualization, analytics, and reporting tools into a single interface, giving you a bird's-eye view of your business's relationship with its customers. From pipeline value to deal velocity, everything is organized to help teams make faster, data-driven decisions.
How Do CRM Dashboards Work?

At its core, a CRM dashboard acts as a reporting tool that consolidates data from various sources, including customer interactions, sales records, marketing campaigns, and customer support activities.
It organizes this data into visually appealing charts, graphs, tables, and other visualizations, making it easier for users to understand complex information at a glance. The data is typically presented in real-time or near real-time, ensuring you always have access to the most current information.
Here's a closer look at how CRM dashboards function:
1. Goal Tracking and Forecasting
By integrating various data sources like customer interactions, sales data, and email marketing campaigns, CRM dashboards provide real-time visibility into key performance indicators (KPIs) and help businesses monitor progress toward their goals.
For example, a CRM dashboard might include metrics like revenue growth, lead conversion rates, or customer satisfaction scores. These metrics can be tracked over time and compared against predefined targets to assess performance and make data-driven decisions.
2. Centralized Data Management
CRM dashboards facilitate centralized data management by pulling information from various sources and presenting it in a unified view. This eliminates manual data gathering and reduces the risk of data inconsistencies or inaccuracies.
Dashboards can integrate with CRM systems, marketing automation tools, customer support software, and other relevant platforms to gather data automatically. Platforms like Ringy, for instance, pull in lead source data, call logs, SMS activity, and email engagement into a single view - so insurance agents and sales reps don't have to piece together information from five different tools. This centralized approach ensures all stakeholders have access to up-to-date, accurate information.
3. Customizable Visualizations
CRM dashboard users can choose from various charts, graphs, and widgets to display their data, allowing them to focus on the most important insights. These visualizations can be tailored to suit different user roles and their specific needs, enabling sales teams, marketing teams, or executives to view the data most relevant to their responsibilities.
For instance, a marketing manager can customize their CRM dashboard to display website traffic, email open rates, and social media engagement metrics. They can choose to visualize this data through line charts, bar graphs, or pie charts, making it easier to identify trends and patterns in marketing performance.
4. Real-Time Data Updates
Data presented in CRM dashboards is usually updated in real-time or near real-time. This ensures that you can access the most current information and make informed decisions quickly. User actions can trigger data updates, such as refreshing the dashboard or selecting different data sources.
Some dashboards also allow users to set automatic data refreshes at predefined intervals, ensuring the dashboard always displays the latest data. A customer support team, for example, can use a CRM dashboard that displays real-time information on open support tickets, response times, and customer satisfaction ratings.
This allows them to identify high-priority issues and allocate resources accordingly, ensuring timely and effective customer service.
5. Performance Monitoring
Successful businesses understand the importance of monitoring their performance and taking corrective measures quickly. CRM dashboards provide users with a comprehensive view of their KPIs, allowing them to identify areas that require attention.
A sales team can track progress daily or weekly using metrics such as booked orders, closed deals, and sales pipeline status. This allows them to spot areas for improvement and implement changes to boost sales performance.
CRM dashboards also provide insights into customer behavior and preferences, which can be used to improve the user experience and increase conversion rates.
6. Data Drill-Down
CRM dashboards offer data drill-down capabilities, allowing users to explore data at a granular level. You can move from summary-level metrics to specific data points by clicking on an area of interest. This drill-down functionality helps you uncover insights, identify root causes of issues, and gain a deeper understanding of the underlying data.
A marketing analyst, for example, can drill into campaign data to examine individual email performance, click-through rates, or conversion rates for different customer segments. This level of detail helps identify which campaign elements are most effective and informs recommendations for future campaigns.
Benefits of CRM Dashboards

You're looking to boost your revenue numbers with every strategy you pursue. That's why it pays to invest in CRM dashboards - they deliver the following benefits:
1. Real-Time Insights and Data Visualization
CRM dashboards provide a comprehensive view of customer interactions and overall performance by consolidating and visualizing data from multiple sources, including sales, marketing, and customer service.
You can track key performance indicators like sales revenue, conversion rates, and customer satisfaction scores in a single dashboard, giving you an at-a-glance overview of your business's health.
2. Enhanced Sales Performance and Forecasting
These dashboards empower sales teams by providing clear insights and facilitating efficient sales performance management. By tracking and visualizing sales activities such as leads generated, deals won, and pipeline status, sales managers can identify trends, spot bottlenecks, and allocate resources effectively.
Here's a comparison of sales performance and forecasting results, demonstrating the impact of using a CRM dashboard versus not using one.
|
Sales Metric |
Without CRM Dashboard |
With CRM Dashboard |
|
Lead Response Time |
24-48 hours |
Under 1 hour |
|
Pipeline Visibility |
40-55% |
75-90% |
|
Rep Productivity |
Baseline |
+22% average increase |
3. Customer Segmentation and Personalization
CRM dashboards offer valuable insights into customer behavior and preferences, enabling effective segmentation and personalized marketing campaigns. You can identify distinct customer segments by analyzing:
- Purchase history and buying patterns
- Browsing behavior and engagement signals
- Demographic information and geographic data
For instance, a CRM dashboard can display customer segments based on purchasing frequency and average order value. This information can be used to create targeted email campaigns with personalized product recommendations, resulting in higher engagement and conversions.
According to research, 85% of marketers believe that targeted personalization increases customer engagement rates. By using your CRM dashboard for customer segmentation, you can deliver tailored experiences that drive loyalty and retention.
4. Improved Customer Service and Support
A CRM dashboard enhances customer service and support by providing a comprehensive overview of customer interactions across various touchpoints. With a unified dashboard, customer service representatives can access customer information - including past inquiries, purchase history, and preferences - enabling them to provide personalized, efficient support.
When a customer contacts your support team, the CRM dashboard can display their previous interactions and ongoing issues, allowing the representative to offer an informed resolution. This not only enhances customer satisfaction but also improves the efficiency of your support operations.
Companies that actively use CRM tools see a 47% increase in customer retention rate, according to Zippia's research - a stat that underscores the value of CRM dashboards for customer support.
5 Enhanced Marketing Campaign Analysis
CRM dashboards play a crucial role in measuring the effectiveness of your marketing campaigns. You can gain insights into the performance of different marketing channels by tracking metrics like:
- Campaign reach and impressions
- Click-through rates and engagement
- Conversion rates and revenue attribution
Because a CRM dashboard can display the ROI of various marketing campaigns, it enables you to identify which campaigns drive the highest revenue. By analyzing this data, you can allocate your marketing budget more effectively and make data-driven decisions.
6. Team Collaboration and Accountability
CRM dashboards encourage collaboration and accountability among team members by offering a centralized platform for sharing information and tracking progress. Dashboards can be customized to display:
- Team-specific metrics and targets
- Individual performance indicators
- Shared goals and milestones
This fosters a sense of ownership and encourages collaboration toward common objectives. Organizations prioritizing collaboration have seen revenue growth over the past three years, with 55% of their workers reporting such growth, according to an Asana study.
What Should a CRM Dashboard Include?

Not all CRM dashboards are created equal. The best ones include a mix of the following components:
|
Dashboard Component |
What It Shows |
Who Benefits Most |
|
Sales Pipeline |
Visual breakdown of deals across stages (leads, qualified leads, proposals, negotiations, closed deals), including deal volume and value to assess pipeline health and identify bottlenecks. |
Sales managers, revenue leaders, and account executives who need visibility into deal progression and forecasting. |
|
Leads and Secured Deals |
Number of new leads, conversion rates, deal values, and lead sources to evaluate lead quality and campaign effectiveness. |
Marketing teams, SDRs, and sales managers focused on lead generation and conversion optimization. |
|
Sales Team’s Recent Activities |
Real-time activity tracking such as calls, emails, meetings, and completed tasks, along with outcomes like opportunities created or deals closed. |
Sales managers and team leads monitoring productivity, performance, and coaching opportunities. |
|
Urgent Tasks |
Overdue tasks, upcoming deadlines, and high-priority activities with reminders to ensure timely follow-ups and task completion. |
Sales reps and SDRs who need to stay organized and prioritize daily activities effectively. |
|
Key Performance Indicators (KPIs) |
Metrics like revenue, average deal size, win rate, sales cycle length, and customer acquisition cost, often displayed in charts or graphs. |
Executives, sales managers, and RevOps teams focused on performance tracking and strategic decision-making. |
|
Customer Segmentation and Demographics |
Breakdown of customers by attributes such as location, industry, age, or behavior to support targeted selling and personalization. |
Sales teams, marketers, and customer success teams aiming to improve targeting and customer engagement. |
Considerations When Creating Your CRM Dashboard

Outlining the objectives you want to achieve with a CRM dashboard is key to designing an effective one. It helps determine which features and metrics are appropriate for your business needs.
So, when creating your dashboard, here are some factors to consider.
The Most Important KPIs
Key Performance Indicators are crucial metrics that measure the performance and success of your CRM initiatives. When creating a CRM dashboard, it is essential to carefully select the most relevant and impactful KPIs for your organization. These KPIs should align with your business objectives and provide actionable insights. For example:
- Customer Acquisition Cost (CAC): This metric helps you understand how much your company costs to acquire a new customer. By tracking CAC, you can assess the effectiveness of your marketing and sales efforts.
- Customer Lifetime Value (CLV): CLV quantifies the total value a customer brings to your business over their entire relationship with your company. It helps you prioritize customer retention strategies and identify high-value customers.
- Conversion Rate: This metric measures the percentage of leads or prospects that convert into paying customers. It provides insights into the effectiveness of your sales process and can help you optimize lead nurturing and conversion strategies.
The Most Important Sales Goals and Methods
Defining clear sales goals and methods within your CRM dashboard is crucial to driving sales effectiveness and growth. These goals should be specific, measurable, attainable, relevant, and time-bound (SMART). Examples of sales goals and methods to consider include:
|
Goals |
Description |
|
Increase revenue by X% |
Setting a specific revenue target helps focus your sales team's efforts and aligns them with the organization's objectives. |
|
Improve win rate |
Monitoring and improving the percentage of won deals can be a key sales goal. This could involve implementing effective sales strategies, refining the qualification process, or providing additional sales training. |
|
Enhance upselling and cross-selling |
Encouraging your sales team to focus on expanding revenue from existing customers through upselling and cross-selling can be an effective sales method. You can track the percentage of revenue generated from upsells or cross-sells to measure success. |
The Appearance of Your Dashboard
Your CRM dashboard's visual design and appearance are crucial in user engagement and data interpretation. An appealing and well-organized dashboard can enhance user experience and make it easier to grasp essential information. Consider the following aspects when designing the appearance of your dashboard:
- Clear data visualization: Utilize charts, graphs, and infographics to present data in a visually compelling and easy-to-understand format. For example, bar graphs can show sales performance by region, or line charts can demonstrate trends over time.
- Color scheme and branding: Choose a color scheme that aligns with your company's branding guidelines. Consistency in color usage can create a cohesive and professional look for your CRM dashboard.
- User customization: Provide options for users to customize the layout and visual elements of the dashboard to suit their preferences and needs. This flexibility ensures a personalized experience for each user.
How Easy Your CRM Dashboard Is to Understand
A CRM dashboard should be designed with simplicity and clarity in mind. It should give users a quick and intuitive understanding of key metrics and trends. Consider the following factors to ensure your CRM dashboard is easy to understand:
|
Criteria |
Description |
|
Clear data hierarchy |
Arrange data and metrics logically and hierarchically. Group related information together, use headings and subheadings and provide clear labels to guide users through the dashboard. |
|
Limit excessive data |
Avoid overwhelming users with an excessive amount of data. Focus on the most relevant and actionable metrics to prevent information overload and make it easier for users to derive insights. |
|
Use concise and meaningful labels |
Clearly label each metric, graph, or section to provide context and enable users to interpret the data effortlessly. Avoid technical jargon or ambiguous terms that may confuse users. |
Integration
Connecting your CRM with relevant tools and platforms allows you to leverage data from multiple sources to gain deeper insights. Examples of integration possibilities include:
- Email and communication platforms: Integrating your CRM dashboard with email clients or platforms allows you to track customer interactions and centralize communication history.
- Marketing automation tools: By integrating your CRM dashboard with marketing automation tools, you can track the effectiveness of marketing campaigns, capture lead data, and analyze campaign performance.
- E-commerce platforms: Integrating your CRM dashboard with e-commerce lets you track customer orders, monitor sales performance, and analyze customer behavior across different channels.
Intuitive Design
An intuitive design is crucial for user adoption and ease of use. A CRM dashboard should be designed to require minimal training or assistance for users to navigate and understand the information presented. Consider the following aspects to ensure an intuitive design:
|
Ideas |
Description |
|
Logical layout |
Organize the dashboard logically, matching how users would naturally expect to access and interpret information. Place commonly accessed features or metrics in easily discoverable locations. |
|
Consistent navigation |
Use a consistent navigation structure throughout the dashboard, with clear menus and sections. Users should be able to move between different dashboard areas without confusion. |
|
Contextual help and tooltips |
Provide contextual help to guide users and provide additional information when needed. This can help users understand unfamiliar terms or functionalities within the CRM dashboard. |
By considering these aspects when creating your CRM dashboard, you can ensure that it effectively presents key information, aligns with your business goals, and provides a seamless user experience, leading to improved decision-making and enhanced sales performance.
CRM Dashboards Examples

CRM dashboards examples are simply part of the reporting tool software that visually represents key CRM metrics and data.
They allow businesses to gain valuable insights into their sales, marketing, and customer service efforts, enabling informed decision-making. The following are some common CRM dashboards examples:
Pipeline Management Dashboard
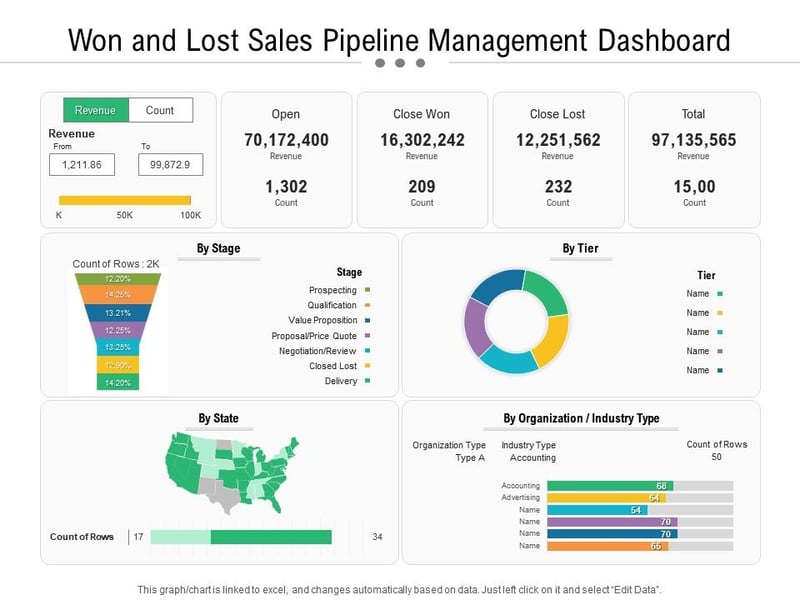
The pipeline management dashboard allows you to track and supervise the progress of sales opportunities as they move through various stages in the sales pipeline. It provides a comprehensive sales pipeline overview, allowing sales managers and representatives to identify bottlenecks, prioritize leads, and forecast future revenue.
Key Components:
- Deal Stages
- Deal Value Distribution
- Deal Velocity
- Win/Loss Analysis
- Sales Forecast
KPI Dashboard
This CRM dashboard tracks and measures important metrics and performance indicators related to sales, marketing, and customer service. It provides a consolidated view of critical data, enabling stakeholders to evaluate the overall performance and identify areas that require attention.
Key Components:
- Sales Metrics
- Marketing Metrics
- Customer Service Metrics
- Goal Tracking
- Trend Analysis
Customer Segmentation Dashboard
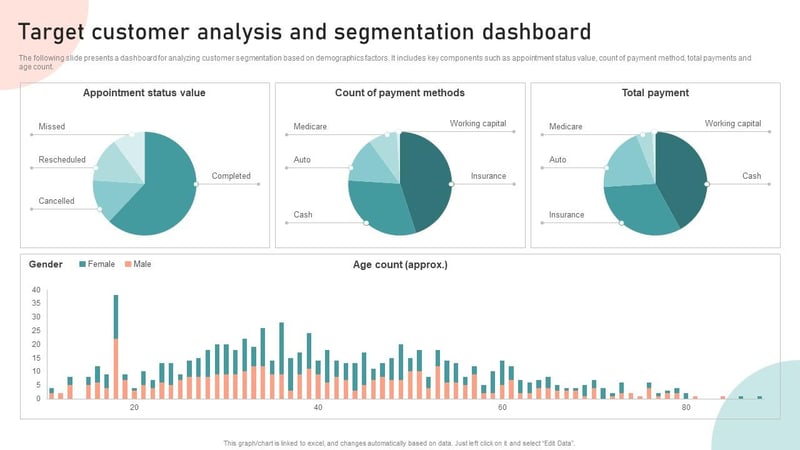
A customer segmentation dashboard divides customers into groups based on specific characteristics or behaviors. It enables businesses to tailor their marketing, sales, and customer service strategies to target each segment better, improving overall customer satisfaction and revenue generation.
Key Components:
- Segment Distribution
- Segment Profiles
- Segment Performance
- Segment Comparison
- Segment Engagement
With CRM dashboards, businesses can gain valuable insights into their sales, marketing, and customer service processes. They empower decision-makers to make data-driven choices, improve operational efficiency, organize contacts, and enhance customer satisfaction, increasing revenue and business growth.
CRM Dashboard: Final Thoughts
The most successful sales teams in 2026 won't be the ones with the most data. They'll be the ones who can see the right data at the right time and act on it before their competitors do. A well-configured CRM dashboard gives you that edge - turning raw numbers into clear direction for your next call, your next campaign, and your next closed deal.
But technology alone doesn't close deals. The businesses that thrive are those that pair powerful tools with genuine human connection, making every prospect feel valued and understood. Your dashboard tells you who to call; your skill and empathy determine what happens on that call.
If you're ready to bring your lead management, automated follow-ups, and performance tracking into one place, check out Ringy to see how a purpose-built CRM can help you dial faster, follow up automatically, and close more deals without letting prospects slip through the cracks.

Skyrocket your sales with the CRM that does it all.
Calling? Check. SMS? Check. Automation and AI? Check. Effortlessly keep in touch with your customers and boost your revenue without limits.