Updated on
 By Carlos Correa
Table of Contents

Sales metrics power sales teams just like a car's engine. And without proper tracking, the teams can lose the direction or grind to a halt, thus underscoring why reps and their seniors need sales dashboard KPIs.
Furthermore, data that does not inform is useless. So, organizations need sales dashboards to visualize, analyze and make decisions. Otherwise, this ever-up-and-down department will run on false narratives.
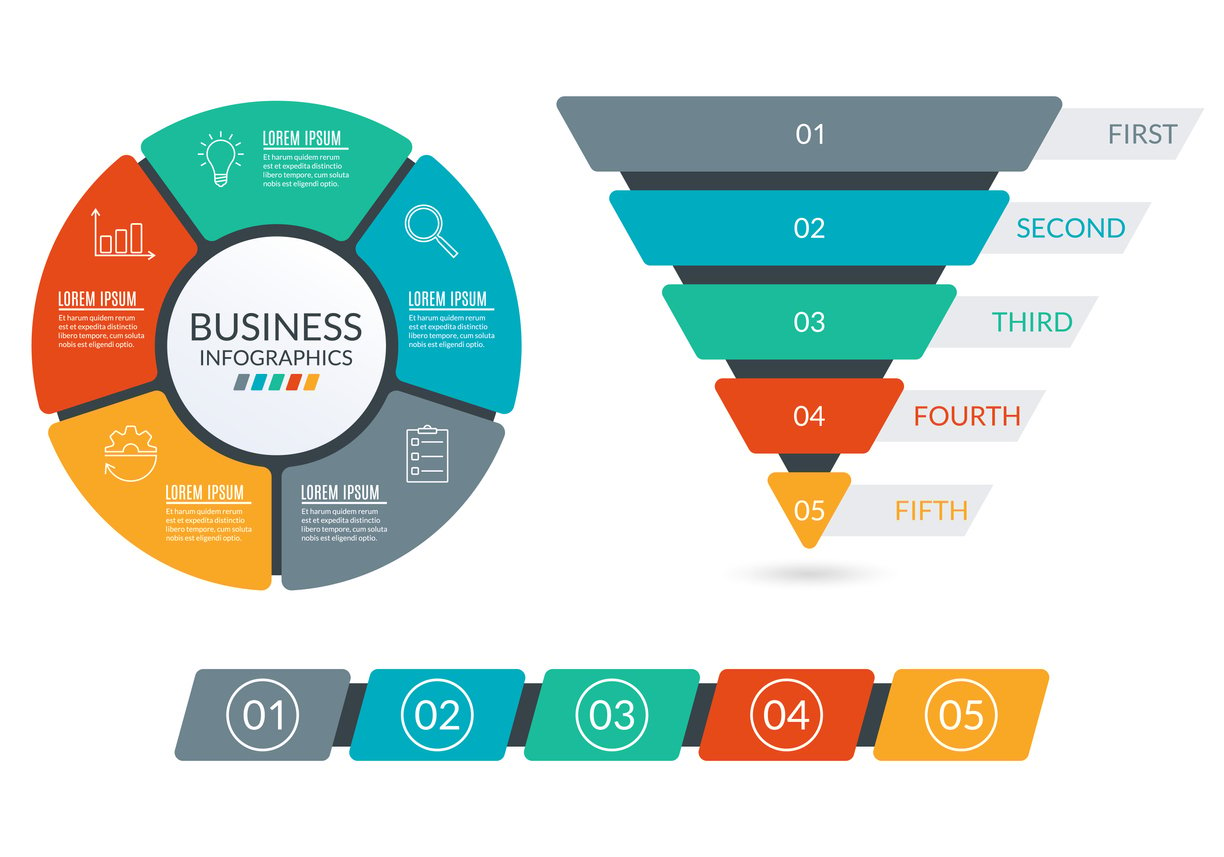
Here is a real-life example to give you a better perspective of a sales KPIs dashboard.
Let's equate it to your car dashboard displaying metrics like speed, fuel level, kilometers covered, seat belt indicator, or windshield washer fluid. All these metrics help drivers make appropriate actions driving and mechanics in diagnosing any problems.
Similarly, such insights are what a sales metric dashboard offers. Every sales activity plus its progress gets measured and displayed on a dashboard to inform progress, what is working, and what needs improvement.
Nevertheless, it is not only about a screen display and a random display of numbers. It is about the metrics helping inform the next courses of action.
With such a perfect example, let's dive deeper into this sales metrics guide and, more specifically, the sales KPIs dashboard, its benefits, and how to create one.
We also look at how to pull data into a sales operations KPIs dashboard, among other crucial aspects.
What Is a Sales KPIs Dashboard?

A sales KPIs dashboard is an interactive tool and a visual display of key performance sales indicators used by business managers and sales teams to gain insight into various sales activities.
Alternatively, we can define it as a sales CRM tool providing real-time sales data to reps and managers to knock off the daily sales challenges.
From the car example, if the seatbelt indicator beeps, you know it is time to buckle up. Likewise, by looking at the sales metrics, reps and managers know the action to take. In other words, sales dashboard KPIs inform and alert users on what is happening.
Additionally, it empowers the sales department and managers to track each sales rep's performance, activities, and sales trends.
Without it, a company would be unaware of what is working or what to change to realize its objectives.
The Importance of Sales Dashboard Metrics
Sales dashboard metrics provide sales departments with several benefits that otherwise would make monitoring and evaluation hectic.
Liken it to the VAR football technology that aids referees in making better decisions on fouls players commit. A referee runs to a screen to review the footage of mistakes that may have escaped him.
Likewise, sales teams run to a sales dashboard to review the ‘footage' of the past day, week, or even month. This helps them see what happened, what is happening, and each activity's direction.
And tracking is one of the most important benefits of measuring sales KPIs. Other benefits of a sales dashboard metric include;
1. It Stimulates Collaboration
Many salespersons are always chasing after individual set targets. While it is good to crunch the numbers and earn bonuses, too much of it kills the collaboration spirit.
However, a sales KPIs dashboard is a great remedy because it allows all to view every activity and where collaboration is needed to achieve specific goals.
Additionally, displaying sales dashboard metrics to other departments encourages teamwork as these departments can provide information on where and how to find, close, and manage better leads.
2. A Sales KPIs Dashboard Increases Staff Motivation

Sometimes tasks seem complex when viewed from an individual lens. Such views often breed procrastination leading to low morale, delayed action, or non-achievement of goals.
But with sales performance on the dashboard which shows how tasks have been broken down into tiny and manageable activities, it encourages individuals to take them up and finish them promptly.
This is a great sales motivation rather than assigning all tasks to an individual. Therefore, the next time your team looks tired and lagging behind, why not try a sales KPIs dashboard?
3. It Fosters Accountability
Sales deadlines are no mean feat to achieve. But as a manager, have you tried sales dashboard KPIs?
With activities and deadlines on display for all to see, the sales team members' work is clearly cut out. This enhances members' accountability to each other and managers because they know the expectations.
In addition, such openness fosters an accountable environment which is key in such an ever-busy department.
4. Gives a Clear Overview of the Department's Activities and Goals
Sales is a broad term that encompasses many smaller activities. All these feed into the primary goal of selling a company's product or service.
And it is crucial to measure how each activity leads to the overall goal so that managers can know how to tweak or overhaul them to make more sales.
A sales KPIs dashboard is the only tool to help in such a case. The tool displays each activity and how much each activity contributes to achieving the goals.
5. Helps Managers Identify Sales Growth Opportunities
Sales dashboard metrics allow managers to identify the best clients, challenges, and actions needed to boost sales.
Ideally, sales managers can see areas needing a change for sales growth opportunities.
6. It Tracks the Performance of Team Members
The metrics on a sales dashboard can be used to track leads and individual sales rep performance.
Such data and measurement help even in rewarding the sales representative. Furthermore, the metrics also inform the best sales method that guarantees results.
How to Create a Sales Metrics Dashboard?

Creating a sales metric dashboard is not a one-size-fits-all affair. A business offering Content Management Software (CMS) will differ from one offering a physical product.
Despite this, there are similar fundamentals on how to create a sales metric dashboard. You should be flexible because technology is ever-evolving, and you do not want your dashboard to be stuck in age-old technology.
Here is the step-by-step process
1. Identify Sales Metrics to be Tracked
Each organization has its targets and goals, which makes measuring each metric critical. In addition, the importance of one metric will differ from one company to another, meaning metric identification is a crucial step to getting the entire process right.
Is it sales metrics, pipeline, leads generation, or primary conversions you want to measure? Answering these questions will help you set the process right, and everything else will fall into its rightful place.
At this stage, asking and answering the following questions will help you ace this step.
- Does your organization have multiple sales teams?
- What do you consider your Key Performance Indicators?
- Are some metrics more important than others?
- Which metrics does your sales department and organization regularly review?
2. Determine the Dashboard's Purpose and Its Users
Even though a sales dashboard might be similar across different organizations, its use may vary.
This calls for an early determination of how you will use the sales dashboard to avoid time wastage by unnecessarily focusing on less crucial items.
Likewise, determine who will use the dashboard and how it will serve the users. Is it the field reps, managers, other interlocking departments, VPs, or executives?
Ideally, this step answers the following:
- Who will use the dashboard?
- How will they use the dashboard?
- What information will the users see?
3. Dashboard Software Selection
This is the most crucial step in actualizing the creation of a sales metrics dashboard. To many, a choice among different options may be hectic, especially if you are a startup or a first-timer.
But it does not need to be!
When choosing the right dashboard software for your needs, simplicity should be paramount. The simpler it is to use and understand, the more effective it will be for everyone involved.
With that said, ensure you adhere to the following:
- Use appropriate chats for different data sets. For example, when presenting revenue values, a bar chart is better than a pie chart.
- Don't include all the information, as the dashboard will look complex and discourage the users.
- Keep the text concise and informative. Avoid blocks of text.
Most CRM software comes with reporting features, thus making data syncing and reporting easier. However, if you are not using one, you can use other tools for syncing and importing data.
How to Pull Data Into a Sales Operations KPIs Dashboard?
Before diving into the data, it's crucial to understand your goals. Here's how you can do this effectively.
Define Your Objectives
Before exploring data, it's essential to clearly define what you want to achieve with your sales dashboard. Are you aiming to improve lead conversion rates? Sales pipeline metrics might be a key focus. Perhaps you want to boost sales rep productivity? Then tracking sales KPIs dashboard metrics like calls made and emails sent becomes crucial. Identifying your goals will guide you in choosing the most relevant KPIs.
Choose Metrics and KPIs
With your objectives locked in, it's time to select the specific metrics and sales operations KPIs that will help you measure progress. There is a wide array of options available, including sales enablement metrics that gauge the effectiveness of your sales training programs and customer acquisition cost (CAC), which reveals the cost of acquiring a new customer.
Remember, a well-designed dashboard should be clear and uncluttered. Focus on the KPIs that provide the most impactful insights for your specific goals.
Select Data Sources and Tools
Your CRM system, marketing automation platform, and even website analytics can all be valuable sources of data for your sales dashboard. Sales operations management software can also be a game-changer, offering a centralized hub for all your sales data.
Once you've identified the data sources, choose the tools that will help you consolidate and visualize the information. Many CRM and sales enablement platforms offer built-in dashboard functionalities.
Design Your Dashboard Layout
The final step is crafting a visually compelling and easy-to-understand dashboard layout. Utilize charts, graphs, and other visual elements to present your chosen sales dashboard KPIs. Keep it clear and concise, focusing on the most important information. Remember, your sales dashboard should be an at-a-glance snapshot of your sales performance, empowering quick decision-making and driving results.
15 Sales Operations Metrics and KPIs for Your Dashboard

While sales are similar across organizations, the operations metrics and sales KPIs for your dashboard will vary from one to the other.
Despite the differences, here are some dashboard KPIs to think about:
1. Lead Conversion Ratio
Lead conversion is the process of turning a lead into a customer. In contrast, the ratio is the number of leads in relation to the total visitors expressed as a percentage.
This is an important sales operations metric because it gives insights into how many visitors make it to the end of the sales funnel.
2. Customer Acquisition Cost (CAC)
This measures how much an organization spends to acquire a customer. It is vital to measure these metrics as it helps businesses know whether the process and costs are worth it.
You can measure the CAC metric by looking at software, equipment, or marketing costs used to convince a client to buy your services.
If the customer is a high-value one, it makes business sense to use more to acquire them, even though you should aim to reduce the cost to its minimum.
3. Customer Churn Rate
The customer churn rate, also known as the rate of attrition or customer churn, is the ratio of customers who stop doing business with you divided by the total number of customers you had at the beginning.
But the biggest headache in this calculation is that different companies use different methods, thus arriving at different answers.
However, your focus should not be on the method (although equally important) but on how to qualify the rate and inform your actions.
So, no matter your chosen method, let it lead you to make a better decision on reducing the churn rate.
4. Customer Lifetime Value (CLV)
The CLV or lifetime value (LTV) is the revenue a customer will generate as they do business with you. Like all other sales operations metrics, it is an important KPI on your dashboard as it informs the following actions:
- How much you can spend on maintaining the customer
- Helps create better customer experience
- It helps determine customer loyalty
- It aids in judging a product or service quality
- It informs your marketing strategy efficacy
5. The Number of Sales Opportunities
This is the number of activities a rep needs to make to open a single opportunity. The metric is calculated by dividing total sales activities by the opportunities created.
Measuring sales opportunities helps you to be more efficient as it offers a better understanding of your clients, which helps you personalize your interactions based on their potential.
The metric helps you to organize prospects based on value and the probability of closing them.
6. Sales Target

Sales target is the minimum quantity you need to sell to make a profit or break even. But it is not just about the numbers but about SMART targets.
An effective sales target should be clearly defined, measurable, attainable, appropriate, and set within a specific timeframe. Strategic management of your sales plan requires you to establish objectives that can direct all involved parties - this begins with determining an achievable goal.
And with such a metric on your sales dashboard, it makes implementation easier for the entire team.
The targets can be per market segment, region, or customer. But ultimately, the goal is to motivate the team toward increasing sales.
7. Sales Growth
Sales growth is your company's ability to generate revenues through sales over a specific period. The metric helps a company know its strengths and weaknesses and informs investors' decisions of whether the company is on an upward or downward trend.
8. Sales Opportunity Score
This is a measure of the likelihood of an opportunity converting positively. It uses a 1-100 score, with a higher score meaning the opportunity is more likely to convert.
As a sales dashboard metric, it helps you know which opportunities are more likely to convert; thus, you can concentrate on them as they have a bigger ROI.
9. New & Expansion MRR
Monthly recurring revenue is the revenue generated by existing customers, while a new MRR is an additional revenue realized from new customers.
It is calculated by summing up all revenues from existing customers in the said month. Measuring this metric helps gauge whether existing customers are buying more or less and how you can up your sales strategies.
10. Upsell and Cross-Sell Prices
Upselling and cross-selling are two selling cousins you can use in your company to grow your sales.
Upselling is a sales strategy of selling a better version of a product a customer currently owns. Alternatively, it can be a similar product but with more benefits. For example, selling a CMS with better features.
On the other hand, cross-selling is a strategy involving selling products related to each other, for example, selling a CMS plus offering content writing services.
The two are critical sales KPIs metrics because they enable you to grow sales or increase a custom's LTV.
11. Sales Cycle Length
This is the average time a sales rep takes to convert a lead to an active buyer. In other words, it measures how quickly or slowly your sales team takes to convince a prospect.
Shorter sales cycle lengths mean reps can make more sales. Furthermore, measuring it gives you a clearer picture of your sales flow chart and the sales op's team efficiency.
Combining this metric with other indicators like LTV, sales target, and CAC provides a holistic and better sales process analysis.
12. NPS (Net Promoter Score)
NPS measures a customer's satisfaction and loyalty. It is calculated by asking customers how likely they are to recommend the company's services to others.
The metric helps you improve delivery, customer support, and service quality, which overall affects MRR and sales growth.
13. Average Revenue Per Unit (ARPU)
ARPU is a product's profitability based on the money generated from each subscriber or user or, in simple terms, the earnings per user or unit.
It is calculated by dividing the total revenue by subscribers, users, or units. Measuring these metrics helps managers know the best or worst-performing market segments or products.
Further, by combining it with the churn rate, you can get more insights into where to make improvements.
14. Sales Per Rep
One of the key sales operations metrics and KPIs for your dashboard is the sales per rep. This KPI measures your team's ability to generate revenue.
Its measurement helps determine each rep's performance, set targets, reward the best performers, and improve overall performance.
It is calculated by dividing the total sales by the number of sales made per rep.
15. Activity Metrics
Activity Metrics provide a window into the day-to-day actions of your sales reps. These metrics don't directly measure revenue, but they offer valuable insights into the efforts being put in and can be a leading indicator of future performance. Here are some key sales operations KPIs that fall under Activity Metrics:
|
Metrics Tracked |
Description |
|
Number of Calls Made |
This is a classic metric that tracks your reps' outreach efforts. It's important to track it alongside other metrics, such as call connect rate and average call duration. |
|
Emails Sent |
This tracks the number of emails sent, and it's also crucial to monitor email open rates and response rates to assess the effectiveness of your email communication. |
|
Meetings Scheduled |
You must also track the meeting conversion rate (meetings that turn into deals) to understand the quality of the meetings being set up. |
|
Demos/Proposals Submitted |
Tracks the number of demos or proposals submitted. It indicates that reps are actively engaging qualified leads and moving them closer to a buying decision. |
Key Sales Metrics Templates

Key sales metrics templates are pre-prepared sales dashboard layouts you can use to develop a personalized dashboard.
Rather than start developing a dashboard from scratch, the templates allow you to feed data, making the entire development process easier and faster.
The inbuilt system of templates comes with regularly assessed metrics, making your job easier to personalize them according to your wants and needs.
Some sales metrics templates you can use include:
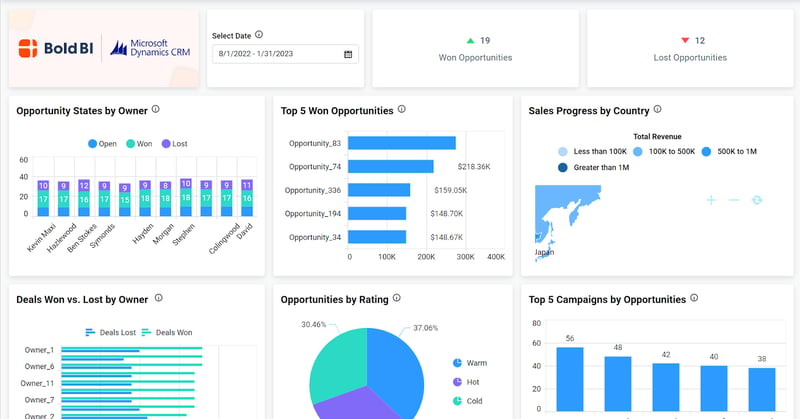
Sales KPI Dashboard
A sales KPI dashboard mainly comprises graphs and charts to give a visual presentation of different KPIs.
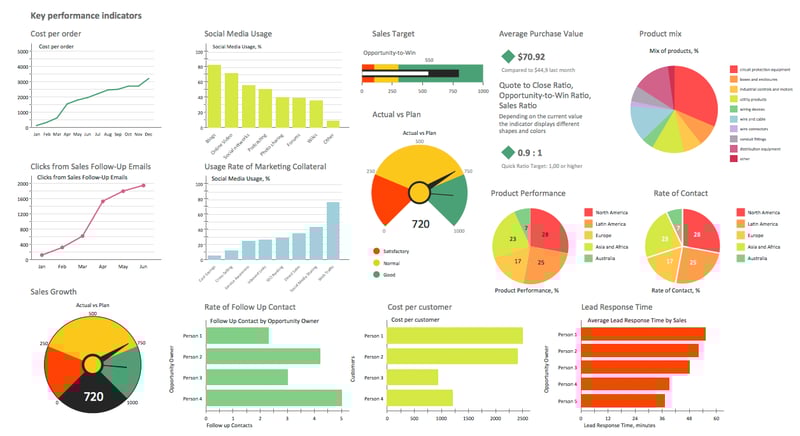
The dashboard allows reps and managers to view result-based data like units sold, conversion rate, and sales by region, among others.
It also lets you see activity-based metrics like emails sent, lead response time, sales cycle length, and calls made.
This dashboard has all the key performance indicators for a rep or the entire sales team, so everything is under one roof.
Some metrics include:
|
Sales KPI |
Role and Benefits |
|
Customer lifetime value |
It indicates a sales team's success in building customer relations and high-value clients. |
|
New leads in the pipeline |
Determine how much to spend on prospecting and how many leads you need to achieve targets. |
|
Conversion rate |
Determines the effectiveness of sales strategies in place or individual sales reps. |
|
Sales volume by location |
Optimizing store and market performance through data-driven decisions, leading to more effective focus strategies. |
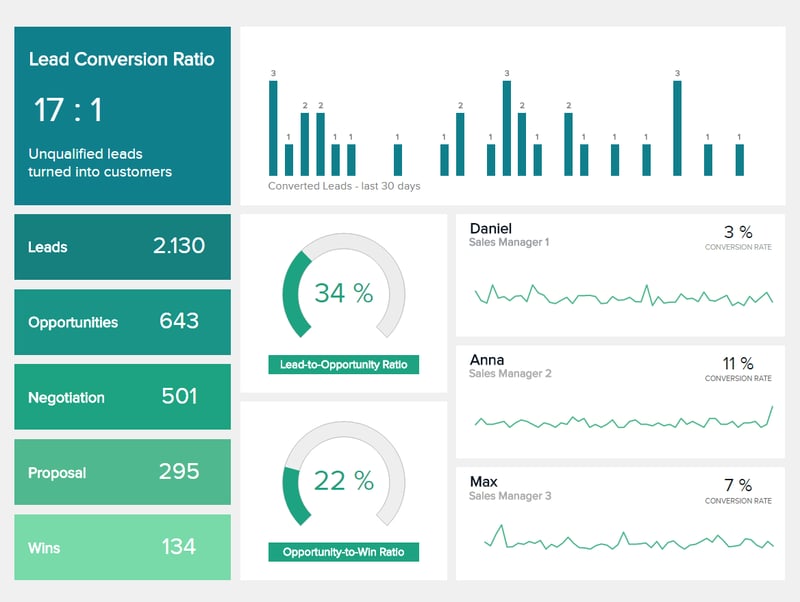
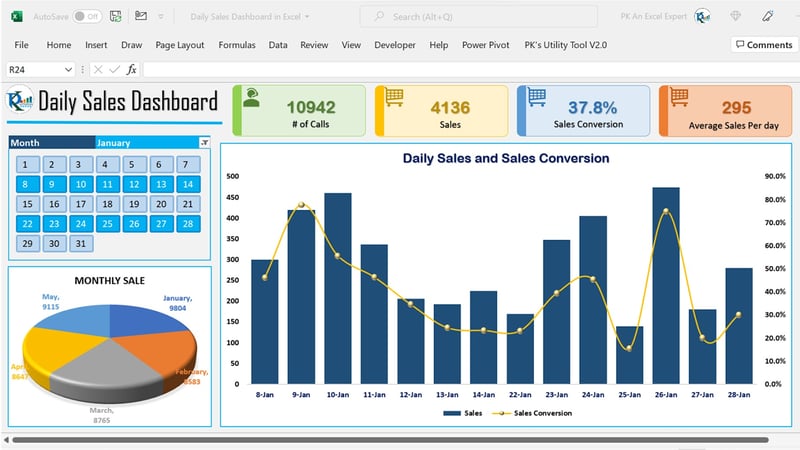
Sales Conversion Dashboard
This dashboard displays data on the effectiveness of your reps in converting leads to active buyers.
Depending on your needs, you can add tracking leads by source and the resulting sales to determine your best channels.
Sales Opportunity Dashboard
This template allows you to create metrics showing areas with future opportunities and what to expect.
This helps you sort the opportunities according to importance, stage, and area and gives a view of performing regions and the value of each opportunity.
Some KPIs and metrics included in this template are:
- Units per transaction
- Average purchase value
- Sales opportunities
- Sales bookings.
Sales Performance Dashboard
This dashboard is a sales performance management tool for any sales organization that wants to gain deeper insights into their sales process, optimize performance, and ultimately drive revenue growth. Here's what it looks like:
Sales Target and Quota Dashboard
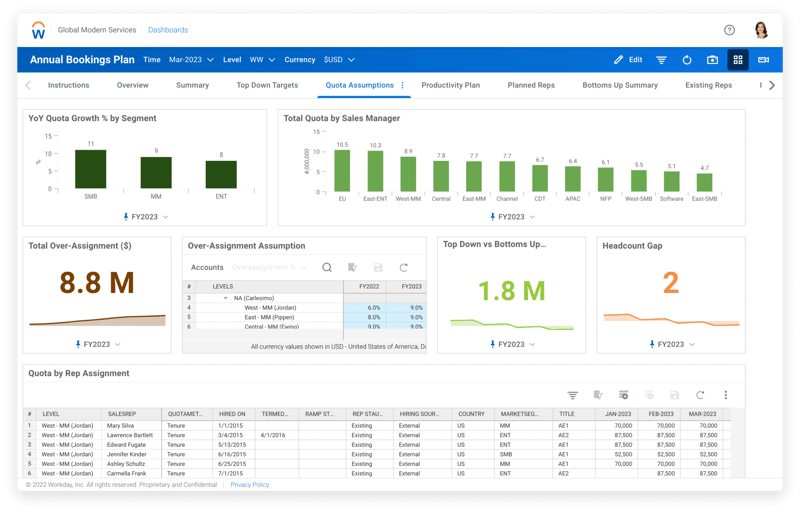
This dashboard focuses on tracking individual and team progress toward achieving sales targets and quotas. They track sales KPIs metrics like:
- Total sales achieved vs. target quota
- Sales rep performance against individual targets (funnel stage breakdowns optional)
- Number of deals closed vs. target
- Sales cycle length
By visualizing these metrics, you can quickly identify reps who are exceeding or falling short of expectations, allowing for targeted coaching and adjustments to sales strategies.
Territory and Regional Dashboard
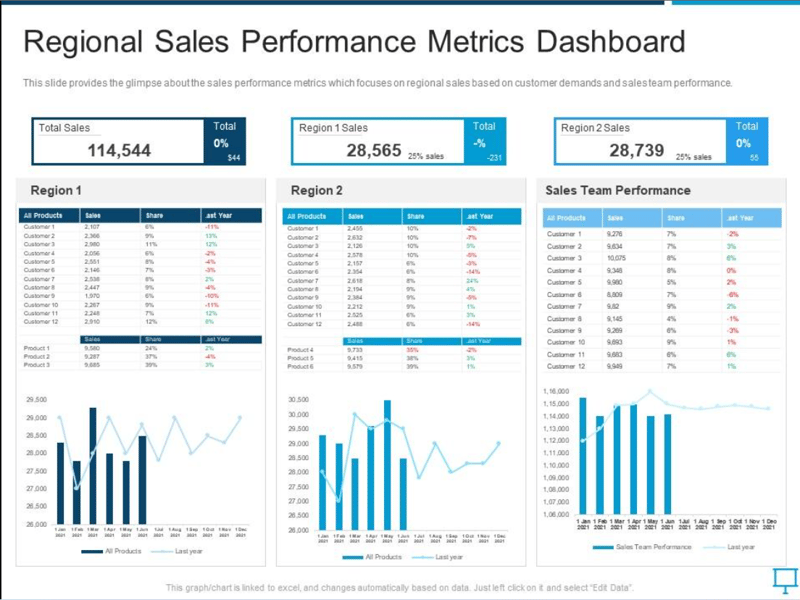
This dashboard provides insights into the performance of your sales team across different territories or regions. Sales metrics for this template could include:
- Revenue generated by each territory/region
- Market share by territory/region
- Sales rep performance within each territory/region
- Lead conversion rates by territory/region
Monitoring these metrics helps you identify high-performing and underperforming regions, optimize resource allocation, and tailor sales strategies to maximize performance across your entire geographical footprint.
How Do KPIs for Sales Operations Help Your Sales Growth?
According to the LinkedIn sales blog, 58% of sales teams admit their sales processes are not data-informed.
The finding also shows that these members struggle to find accurate data because it is often buried deep in the organization.
This means access to accurate and up-to-date data is crucial in informing the entire sales value chain, from planning to execution, monitoring, and evaluation. Essentially, KPIs for sales operations play a major role in growing your sales.
But how do these key performance indicators help?
1. Sales Ops KPIs Help in Reviewing Progress
Measuring KPIs for sales Operations enables teams to track progress against set targets. Thus, these performance indicators show the gap between current sales and targets.
Essentially, the KPIs are akin to landmarks when on an unfamiliar path. They help you determine if your team is on the right path and what sales activities are fruitful.
2. Enhances Project Management
A sales ops crew and the larger management are better positioned to manage a sales project when data is available.
This helps an organization grow its sales because it knows which sales process is working or not.
3. Helps in Figuring Out Sales Growth Impediments
Measuring KPIs for sales operations empowers the team to understand the challenges in achieving sales goals or growing the numbers.
Consequently, when such performance indicators are measured, the team identifies underlying problems for improvement.
4. Helps in Opportunity Identification
Sometimes, sales are difficult to close. From identifying a prospect and leading them to the final decision-making step, it is easy for these leads to slip away.
But when you have a KPI for every sales operation, it is easy to identify opportunities and dedicate more energy to them or areas where they are likely to slip away.
Conclusion
Sales dashboard KPIs are a great way to get a better look and feel of your sales team's performance.
The indicators provide insights into what is working, helping make data-driven decisions. Due to its immense benefits, using a sales CRM is non-negotiable for any sales executive.
So, looking to begin a sales KPIs dashboard? Rindy's sales CRM is the software to go for due to its ease of use, its high rate of customization, and its ready-to-help customer service team.
Contact us today to start measuring your sales pipeline metrics, sales ops metrics, and general sales operations management.

Skyrocket your sales with the CRM that does it all.
Calling? Check. SMS? Check. Automation and AI? Check. Effortlessly keep in touch with your customers and boost your revenue without limits.

Related Articles