Updated on
 By Robins Dorvil
Table of Contents

How do you get information to make effective business decisions? Do you rely on your experience, gut feelings, or data?
If your answer was all three, then you're on the right track! But the most important factor in making effective business decisions should be looking at the data—it's the most objective way to see what's going on with your business operations and customers, after all.
That's where reporting tools come in handy. Instead of gathering data from all the different pieces of software your organization uses daily, reporting tools can do this for you. Not only that, but these tools also aggregate this data and present it in a comprehensive report that is ready for you to glean insights from.
Imagine seeing key information at a glance whenever you need to so that you always understand what's going on with your teams and your business.
With most data reporting tools, you can customize the final report's information. Wit Ringy, for example, essential information like drip marketing analytics, team performance, lead status reports, and much more can easily be accessed at a glance via your reports dashboard. This allows you to easily keep track of important metrics in real time without you having to constantly generate a report. Plus, Ringy's reporting tools are integrated into customer relationship management (CRM) software, so you don't have to switch between different software to see the key indicators that you care about.
In this article, we explore more about data reporting tools, including why they are essential for business intelligence, basic reporting tools that you should look for in CRM software, how to choose the right data reporting tools, and finally, some recommendations for great options that you can implement into your business right away.
Why Using CRM Reporting Tools is Essential for Your Business

Your CRM is very much the core of your business software, as it houses all of the information about your customers, including contact information, purchase history (or their position in your sales funnel), conversation history, and more. Therefore, it makes sense that any reporting tools software that you use should be integrated into your CRM so that you can glean the best information from them.
Reporting software tools provide valuable insights into individual and team performance and business operations. They also help you understand your customers better by providing information on demographics, spending habits, and more. Reports help people find patterns, trends, or relationships between different variables (e.g., does seasonality affect customer spending?) and draw conclusions from this data.
You can make more informed and data-driven business decisions by tracking key metrics using data reporting tools.
Significance of Reporting Tools in Business Intelligence
You might have heard the term “business intelligence” before, but what does it actually mean? Business intelligence, often shortened to BI, is the act of preparing, analyzing, and presenting various business metrics-so it's easy to see why reporting tools and BI go hand in hand.
With BI, reporting is often divided into two categories:
|
Category of BI Reporting |
Description |
|
Managed reporting |
When a technical employee such as IT or a data analyst prepares a report for a non-technical audience to view and glean insights from. |
|
Ad-hoc reporting |
Often a feature in BI software that allows non-technical users to create reports from scratch or edit pre-existing reports without involving IT. |
Reports can be presented in various formats, such as spreadsheets, tables, and graphs. Most data reporting tools have the capability to automatically generate reports for a specific time frame based on set criteria. This makes it easier to keep on top of viewing current data, as usually the report is sent straight to your email address or prepared so that the information can be downloaded directly from your CRM or reporting tool.
Benefits of Reporting Tools
You can make better business decisions by tracking key metrics in reporting tools software. Here are some important benefits of reporting software tools to keep in mind:
- They help you understand what's happening in your business. Without looking at the data, you can't be sure about what's influencing your customers to buy or how your sales and marketing teams are performing. With reporting tools, you can track key metrics like Customer Acquisition Cost (CAC), retention rate, customer churn, overall sales performance, marketing channel performance, and more to identify patterns and trends. This information can then be used to adjust your strategies to improve your customer service, sales, and marketing initiatives.
- You can make more confident strategic decisions. By tracking customer data, you can make better decisions on focusing your business's efforts and resources to maximize customer relationships and satisfaction. For example, you could gain insight into an untapped market to focus on or better tailor your services to meet your customer's changing needs.
- Management can track performance. It's important that supervisors and managers track the performance of their marketing and sales teams so that they can identify opportunities for growth and improvement. Reporting tools are a great way to objectively track the performance and the popularity of different products and services.
- Collaboration efforts are simplified. Your CRM is a repository of customer conversations, notes, interactions, transactional data, contact information, and more. Having all this information in one place makes it much easier for your reps to find the information they need. Combined with reporting software tools, you and your team can find commonalities between customers, leading to more creative ways to engage with those customers and offer them more personalized services and offers.
Basic Reporting Tools in CRM Software

There are a wide variety of reports available that you can run in most CRMs. These reports can be included in the CRM by default or become available through integrations and APIs. While most CRMs have a dashboard where high-level information in the reports is typically available, you can usually also set the system to run reports for different information.
Here are some basic reports that can often be run in CRM systems:
|
Type of Report |
Description |
|
Sales funnel reports |
These reports provide insight into how your sales funnel is performing, particularly through:
|
|
Win-loss reports |
A win-less report helps companies understand the factors that contribute to completing (winning) or losing the sale. It includes:
|
|
Lead reports |
Lead reports give you insightful information about the leads that you're gathering, including:
|
|
Sales forecast reports |
A sales forecast is an in-depth report that helps companies make realistic predictions about future sales. These reports typically include:
|
|
Revenue reports |
A revenue report helps businesses keep track of metrics like sales, profit, and cash flow. These reports usually include:
|
|
Performance reports |
A performance report is used by management to determine the overall performance of an individual employee or an entire team. These reports usually include:
|
|
Profitability reports |
These reports outline where the money is coming from. Specifically, these reports highlight:
|
6 Types of Software Reporting Tools

Software reporting tools come in various forms, each tailored to specific business needs and preferences. Let's explore some of the common types of reporting tools and their key features.
1. Business Intelligence (BI) Tools
BI Tools are designed to extract and analyze data from various sources to provide insights into business operations. These tools often feature interactive dashboards, data visualization capabilities, and advanced analytics functionalities. BI tools empower users to explore data trends, uncover patterns, and generate actionable insights to drive business growth and efficiency.
2. Data Visualization Tools
Nobody likes looking at walls of text. Data visualization tools present data in visually appealing and easily understandable formats such as charts, graphs, and maps. These tools enable users to create compelling visualizations that communicate complex information effectively. With drag-and-drop interfaces and customizable templates, data visualization tools empower users to create interactive dashboards and reports without requiring extensive technical expertise.
3. Custom Reporting Tools
Every business has unique processes and procedures that make custom reporting tools necessary. These tools simplify the process of generating and distributing reports by automating repetitive tasks and streamlining workflows. They allow users to design custom reports, schedule automated report generation, and share reports with stakeholders via email or web-based portals. Reporting software enhances efficiency, accuracy, and collaboration by centralizing reporting processes and ensuring data consistency across the organization.
4. Self-Service Reporting Tools
Not everyone at a company is a tech genius, but they still need the information from reports. Self-service reporting tools empower non-technical users to create and customize reports independently without relying on IT support. These tools feature intuitive interfaces and drag-and-drop functionality, allowing users to easily access data, build queries, and design reports. Self-service reporting tools promote data democratization and foster a culture of data-driven decision-making across organizations.
5. Ad-Hoc Reporting Tools
Did your boss randomly ask you for a report, and you didn't have anything ready? Ad-hoc reporting tools enable users to generate on-demand reports quickly and easily to address specific business questions or requirements. These tools offer flexible querying capabilities, allowing users to explore real-time data and customize report parameters as needed. Ad-hoc reporting tools provide agility and responsiveness, enabling organizations to adapt to changing business conditions and make informed decisions on the fly.
6. Data Analysis Tools
Sometimes you need to dive deeply into different data points to extract meaning. Data Analysis tools focus on performing in-depth analysis and statistical modeling to extract meaningful insights from complex datasets. These tools offer advanced analytics capabilities such as predictive modeling, regression analysis, and machine learning algorithms. Data Analysis tools empower users to uncover hidden patterns, forecast future trends, and make data-driven predictions to guide strategic decision-making.
How to Choose the Right Reporting Tools for Your Business

While reporting tools are important, a wide range of options exist. This can make it overwhelming to choose the right solution for your business. To make the process of choosing an option easier, follow these recommendations of what to look for in a reporting tool:
- Scalability and flexibility: As your business grows and adds more customers and employees, you'll want to invest in reporting tools that will be able to grow with you. This includes being able to handle larger amounts of data and still be able to provide real-time insights.
- Integration with existing systems: Chances are your business uses a range of software daily. It's essential that the different software in your tech stack is able to sync together so that data can be shared between different programs seamlessly. Your reporting tools are no different. Making sure that your software reporting tools can access essential data from all of your different systems and programs is essential for you to be able to get the best insights and information from them.
- User-friendly interface: If you invest in software that's difficult to use, it will not only be much harder to train your employees on how to use it effectively, but they might opt to not use it if it makes their job more difficult or time-consuming. Reporting tools should be robust enough that technical employees can create comprehensive reports, but also easy enough to use so that non-technical employees can also create simple reports that give them the insights they need.
- Cost vs. features: Determining how much you should spend on reporting tools might seem difficult with all the different options available, but it can actually be pretty straightforward. The best course of action is to determine which reporting features that you absolutely need. These could be things like robust lead and sales reporting options. Once you've determined which features you'd like to have in software reporting tools, search out options and make a list of them. Websites like G2, Capterra, and Software Advice can organize your selections into a comparable table, helping you get an average price range for a tool that includes the features you want.
6 Top Reporting Tools
Beyond traditional CRM functionalities like contact management and sales automation, CRM reporting tools empower businesses to analyze, visualize, and derive actionable insights from their data. Let's explore some of the top CRM reporting tools that enable organizations to harness the power of data for informed decision-making.
1. Ringy
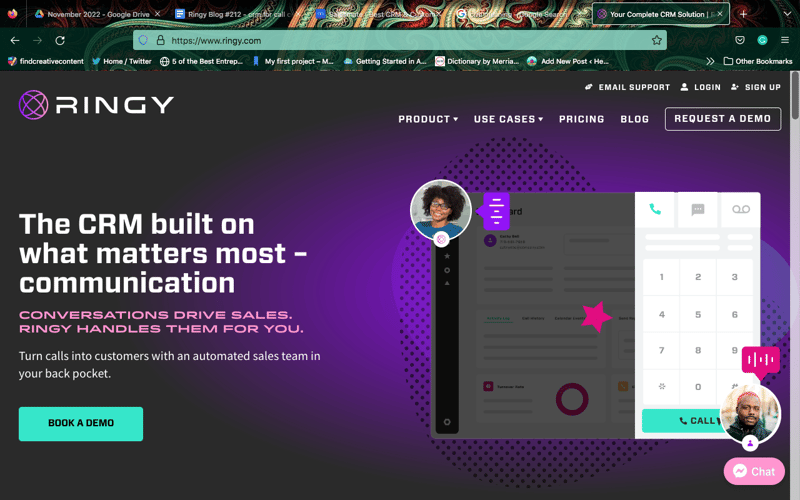
Of course we're going to mention Ringy. It's a comprehensive CRM with robust reporting tools baked into the system, especially when it comes to getting data on your leads, sales, and marketing initiatives. With comprehensive and easy-to-view dashboards, you're able to view information regarding:
- Your performance, including how many calls you've made in a day, leads that you're scheduled, lead disposition data, and drip marketing analytics.
- Team analytics, including total calls, quick user summaries (leads sold, inbound texts received, inbound calls received, etc.), lead information, and more.
- Company analytics, including total calls, lead status reports, and account access history.
Depending on the information you want to look at, you can toggle between list and table views for easier viewing. Plus, certain information can be downloaded directly via .CSV files for you to delve deeper into as needed.
2. Salesforce Analytics
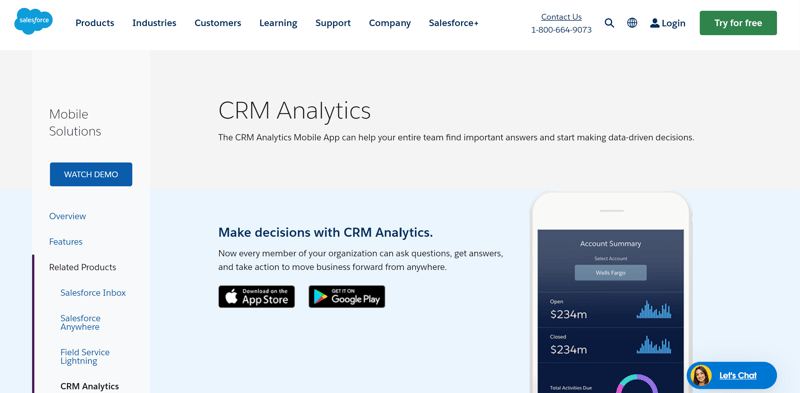
Powered by Einstein AI, Salesforce Analytics is a robust reporting and analytics platform integrated with the Salesforce CRM ecosystem. It offers a wide range of features including customizable dashboards, interactive data visualization, predictive analytics, and AI-driven insights. With Salesforce Analytics, businesses can uncover trends, forecast outcomes, and optimize sales and marketing strategies to drive revenue growth.
3. Microsoft Power BI
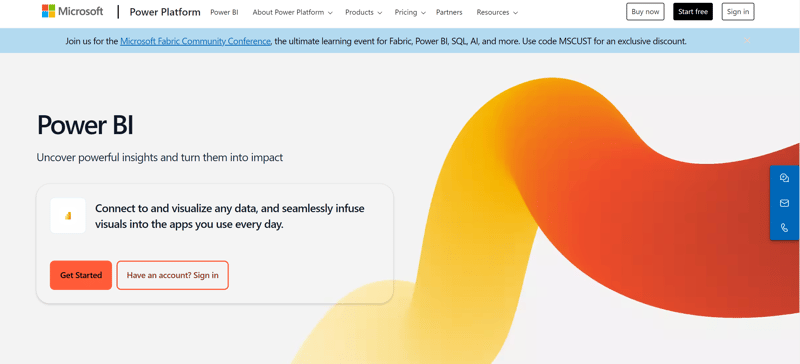
Microsoft Power BI is a leading business intelligence tool that seamlessly integrates with Microsoft Dynamics 365 CRM and other data sources. It enables users to create interactive reports, dynamic dashboards, and real-time analytics to gain deeper insights into customer behavior and sales performance. With features like natural language querying and AI-driven insights, Power BI empowers organizations to make data-driven decisions and accelerate business growth.
4. Zoho Analytics
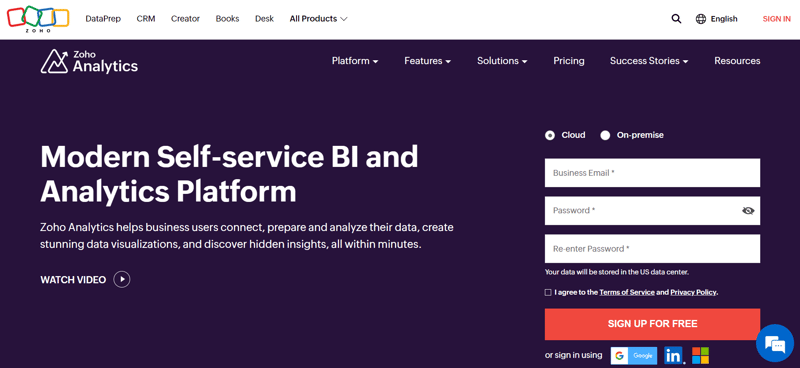
Zoho Analytics is a comprehensive reporting and analytics tool that seamlessly integrates with Zoho CRM and other third-party applications. It offers a wide range of features including drag-and-drop report builders, customizable dashboards, and advanced analytics functions. With Zoho Analytics, businesses can track key performance indicators, visualize sales trends, and gain deeper insights into customer behavior to drive strategic decision-making and business growth.
5. HubSpot Reporting
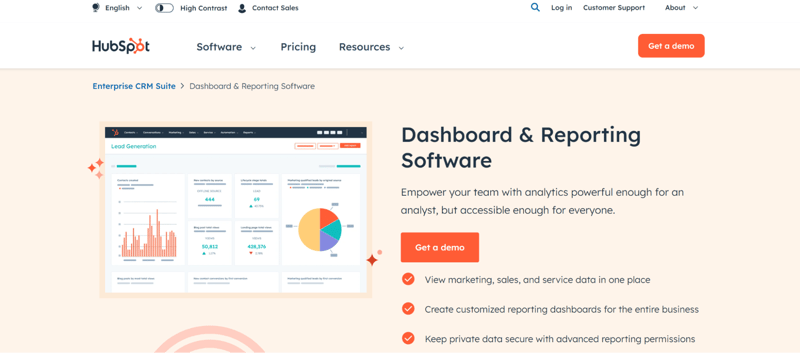
HubSpot Reporting is an intuitive reporting tool integrated with the HubSpot CRM platform, designed to help businesses track and analyze sales, marketing, and customer service data. It offers customizable dashboards, real-time analytics, and performance metrics to monitor pipeline health, campaign effectiveness, and customer satisfaction. With HubSpot Reporting, businesses can optimize their CRM workflows, improve sales efficiency, and deliver personalized customer experiences.
6. Tableau CRM
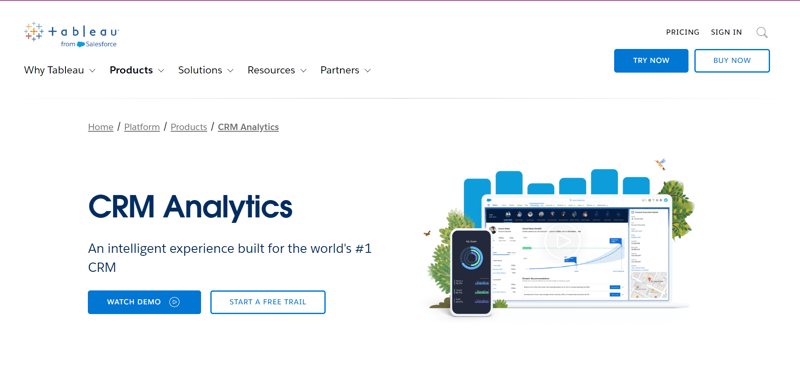
Tableau CRM, part of the Salesforce ecosystem, combines powerful analytics capabilities with intuitive data visualization to deliver actionable insights for CRM users. It offers pre-built dashboards, predictive analytics, and AI-driven recommendations to help organizations uncover hidden patterns, identify opportunities, and optimize customer engagement strategies. With Tableau CRM, businesses can drive productivity, enhance customer satisfaction, and achieve business objectives.
Conclusion
Navigating the data landscape and harnessing the power of reporting tools is essential for modern businesses to thrive in today's competitive environment. Organizations can make informed decisions that drive growth and success by relying on data-driven insights rather than mere intuition.
Reporting tools offer a comprehensive solution for gathering, analyzing, and presenting data from various sources, enabling businesses to gain valuable insights into their operations, customer behavior, and market trends. With customizable dashboards, real-time analytics, and predictive capabilities, these tools empower users to uncover hidden patterns, identify opportunities, and optimize strategies for maximum impact.
Whether it's:
- Salesforce Analytics
- Microsoft Power BI
- Zoho Analytics
- HubSpot Reporting
- Ringy
- Tableau
Each CRM reporting tool brings unique features and capabilities to the table. Organizations can unlock the full potential of their CRM data and drive business success by choosing the right tool that aligns with their business needs and objectives.
In today's data-driven world, effective reporting tools are not just a luxury but a necessity for businesses looking to stay ahead of the curve. By investing in the right reporting tools and leveraging the power of data, organizations can gain a competitive edge, enhance decision-making processes, and confidently achieve their goals.
Discover how Ringy's reporting tools can help you keep a pulse on your sales performance today. Reach out to us for a demo!

Skyrocket your sales with the CRM that does it all.
Calling? Check. SMS? Check. Automation and AI? Check. Effortlessly keep in touch with your customers and boost your revenue without limits.

Related Articles